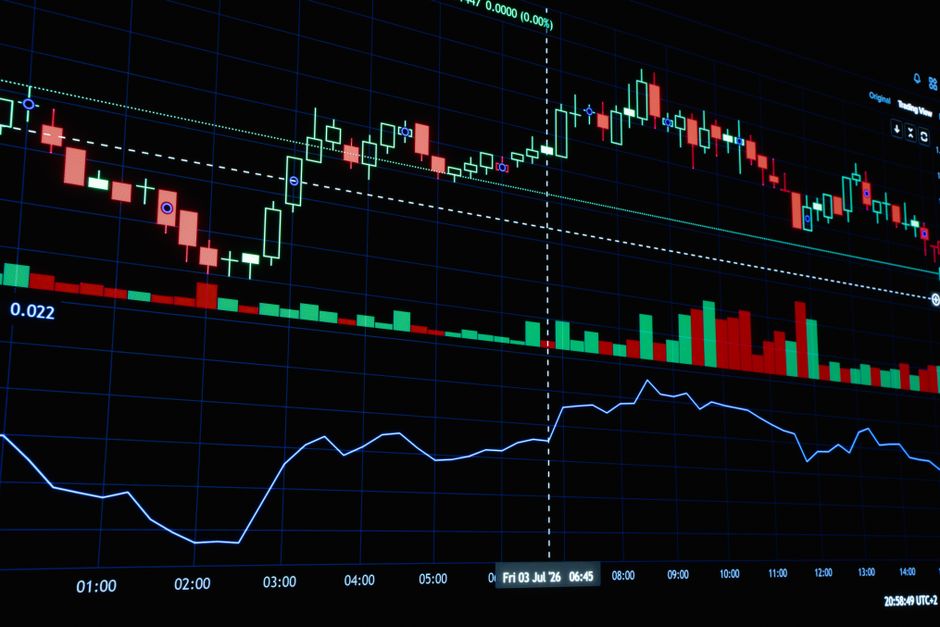
Bitcoin Price at $80,000: Key Level That Could End the Bear Market
Bitcoin has surged back above the $80,000 mark for the first time since May, accelerating a crypto recovery that has already outpaced both stocks and gold over the past six months. Yet the rally's durability now hinges on a single make-or-break test: whether the cryptocurrency can defend this freshly reclaimed territory through its next pullback. Until that test resolves, the question of whether the bear market is genuinely over remains open.
Market Impact & Global Context
In technical terms, $80,000 functions less as a number than as a verdict. Price levels where an asset previously stalled represent trapped overhead supply, and when an asset reclaims them, sidelined sellers get a second chance to exit — which is precisely why first retests so often fail. A decisive hold above the mark would convert former resistance into support, the classic structural signature separating a new uptrend from a mere bear-market bounce.
The demand side of this recovery looks firmer than typical speculative rallies. Spot Bitcoin ETFs just logged their seventh straight day of net inflows as the rally holds above $80,000, evidence that institutional allocators — not merely leveraged futures traders — are driving this leg higher. Sustained ETF creations absorb spot supply directly, tightening the tradable float in a way momentum-chasing alone does not. For US equity investors, the flows double as a sentiment gauge: persistent crypto accumulation often travels alongside broader risk appetite, while an abrupt reversal would serve as an early warning for high-beta segments of the market.
The relative-performance picture raises the stakes further. Outrunning both equities and gold for six months implies capital is actively rotating into Bitcoin rather than parking there defensively — a pattern that tends to attract trend-following funds across the US, Europe, and emerging markets. Emerging-market participants watch such episodes especially closely, since local currency weakness historically amplifies demand for dollar-denominated stores of value. The flip side: if the $80,000 zone rejects price and the next pullback breaks down decisively, the same momentum machinery can unwind fast, punishing crypto-linked equities and miners that trade with amplified sensitivity to the coin itself.
According to market analysts tracking institutional flows, the distinction between a relief rally and a genuine regime change will be settled by price behavior, not headlines."Seven straight days of ETF inflows tell you institutions are participating in this move. But the real information arrives with the first meaningful pullback — if buyers defend the reclaimed level instead of rushing for the exits, that's when a bear market can credibly be called over."
Key Takeaways
- $80,000 is the litmus test: holding the level through the next pullback would turn old resistance into support — the textbook confirmation of a trend reversal.
- ETF flows are the quality check: seven consecutive days of net inflows point to institutional participation rather than leverage alone.
- Relative strength favors bulls: six months of outperformance versus stocks and gold signals active capital rotation into crypto.
- Risk cuts both ways: a failed retest could trigger rapid deleveraging, with crypto-exposed equities hit hardest.
Frequently Asked Questions
What Bitcoin price level would confirm the bear market is over?
Analysts are focused on whether Bitcoin can sustainably hold the newly reclaimed $80,000 area through its next significant pullback. There is no single magic number — confirmation comes from former resistance behaving as support on retests, ideally reinforced by continued ETF inflows rather than any one daily close.
Do Bitcoin ETF inflows reliably predict a new bull market?
Sustained streaks like the current seven-day run of inflows indicate genuine institutional demand absorbing spot supply, which historically underpins more durable trends. Still, flows are a coincident signal, not a guarantee — they can reverse sharply in risk-off episodes, so traders pair them with price structure before calling a new bull phase.